
When determining which mass spectrometer to purchase, resolution may be an important factor to consider. The type of analysis being performed can dictate the resolving power required. The following table depicts the average resolving power of different types of mass analyzers.
| TYPE OF MASS ANALYZER | TYPICAL RESOLVING POWER (m/Δm, FWHM) | KEY CHARACTERISTICS |
| FT-ICR-MS | ~200,000–1,000,000+ | Highest resolving power available in commercial MS systems; used for ultra-high-resolution research applications. |
| Orbitrap | ~60,000–500,000+ | High-resolution and high-mass-accuracy analysis widely used in proteomics and metabolomics. |
| High-Res-TOF | ~20,000–100,000+ | High-res TOFs are known for maintaining high resolving power at fast scanning speeds (e.g., >10 Hz), ideal for GC-MS and LC-MS techniques. |
| TOF | ~10,000–60,000+ | High acquisition speed and accurate mass measurements; commonly used in LC–MS and MALDI systems. |
| Ion Trap (3D or Linear) | ~1,000–10,000 | Capable of MSⁿ experiments; moderate resolving power suitable for structural analysis. |
| Triple Quadrupole (QQQ) | ~1,000–2,000 | Optimized for targeted quantitative LC–MS/MS workflows with high sensitivity and throughput. |
| Quadrupole | ~500–2,000 | Unit mass resolution; widely used for routine analysis and scanning mass spectrometry. |
The resolving power of different mass analyzers currently on the market.1 | ||
Resolving Power
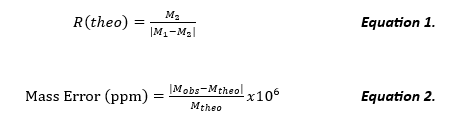
When separating two ions in the mass spectrometer, the resolving power can be defined as the larger mass to charge ratio (m/z) of interest divided by their difference (Equation 1). This is not to be confused with mass error, which considers the theoretical m/z compared to the observed molecular ion, often reported in ppm (Equation 2). For R(theo), the theoretical resolving power required to separate two isobaric ions (two ions with equal nominal masses that vary in fractional differences), M1 represents the first ion of interest and M2 represents the second ion of interest. For example, if one wanted to separate CO2 (43.989830 amu) from (CH2)2O (44.026215 amu), most likely molecular fragments in this case deduced from a neutral loss scan, an approximate resolving power of 1200 would be required to distinguish the two ions from one another.
R(actual), the actual resolution of the experimental data, often calculated from the FWHM approximation from the Gaussian curve, is depicted below in Equation 3. M1/2(σ-) is the m/z at ½ peak height on the fronting end of the peak observed (Imax @ σ- /2) and M1/2(σ+) is the m/z of ½ peak height on the tailing end of the peak observed (Imax @ σ+ /2) (otherwise defined as peak width differential) (See Figure 1).
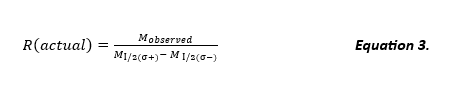
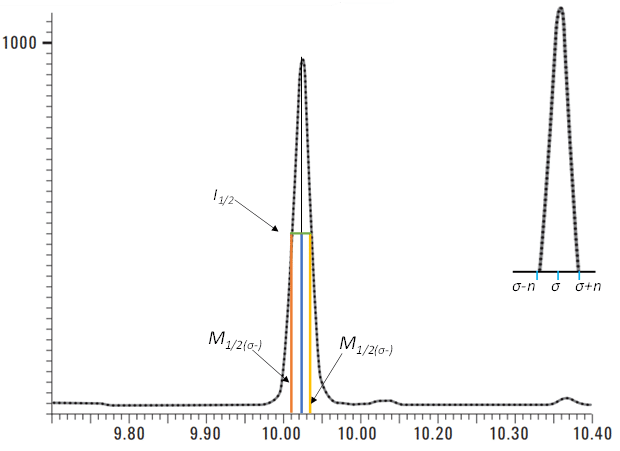
Figure 1. A detailed description for the derivation of Equation 3. (Modified Figure from Ref. (3)).
Which mass spectrometer to purchase?
When selecting a mass spectrometer, resolving power is often a critical consideration depending on the analytical objective. High-resolution mass analyzers such as time-of-flight (TOF), Orbitrap, and Fourier transform ion cyclotron resonance (FT-ICR) systems provide the resolving power necessary to distinguish ions with very small mass differences. In contrast, triple quadrupole (QQQ) instruments are optimized for targeted quantitative analysis and high sample throughput rather than ultra-high resolution.
Price considerations also come into to play for most laboratories. Orbitrap mass analyzers are among the highest resolving instruments on the market, but are also expensive. High resolution TOFs with reflecting capabilities rival the resolving power of Orbitraps. These TOFs enhance selectivity through reflecting capabilities that correct for deviations in kinetic energy equivalencies such as the V and W-mode features in Waters Synapt series and the multi-reflecting TOF (MRT). Figure 2 compares the resolution capabilities of an orthogonal TOF in V and W mode for varying charge state ions along with an ion trap with and without a Fourier Transform Ion Cyclotron Resonance Mass Analyzer (FT-ICR MS) coupled to the trap (low- and high-resolution scans).
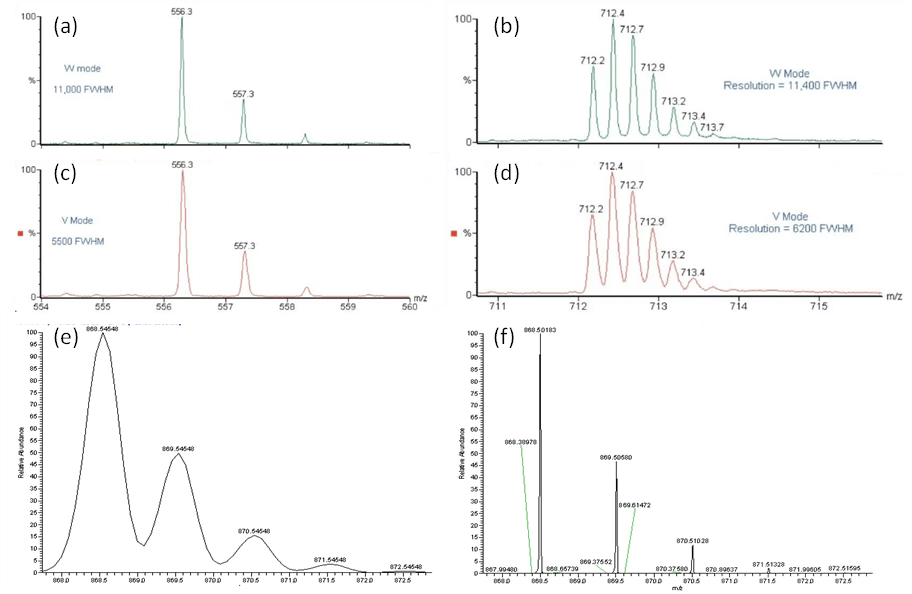
Figure 2. Example spectra of (a-b) W-mode (c – d) V-mode and analyses via the Waters LCT Premier Orthogonal TOF at for (a, c) singly charged ions (m/z 556) and (b, d) quintopoly charged ions (m/z 712).2 Example spectra of (c) low and (d) high resolution data acquired on the Thermo Fisher LTQ Linear Ion Trap and LTQ-TF Linear Ion Trap coupled to a Fourier transform ion cyclotron resonance (FT-ICR) mass analyzer.1
Resolution and Contaminants
The importance of resolution is really apparent when considering the presence of contaminants co-eluting or overlapping on the mass spectrum. As shown in Figure 3 below, the quadrupole analysis is incapable of resolving the contaminant that is isobaric to the analyte of interest, sulfacetamide; but the resolution in the TOF when considering the standard deviation is clearly capable of distinguishing the two.
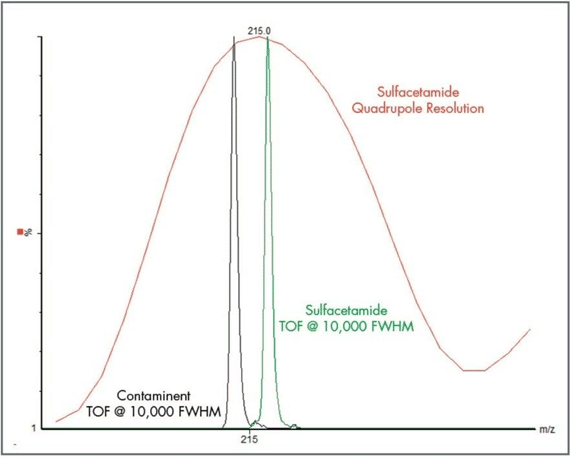
Figure 3. A comparison of quadrupole vs TOF resolution for the detection of sulfacetamide in the presence of a contaminant.2
It is important to separate isobaric ions (Figure 3). But in some cases, isotopic resolution might be required for structural characterization or charge state determination (Figure 4). By comparing the relative abundance of the second isotope to the first, elemental composition can sometimes be achieved. In addition, a simple calculation between the difference between the first and second isotope will tell you the charge state of the molecular ion observed. Figure 3 displays the difference between high and normal resolution data.
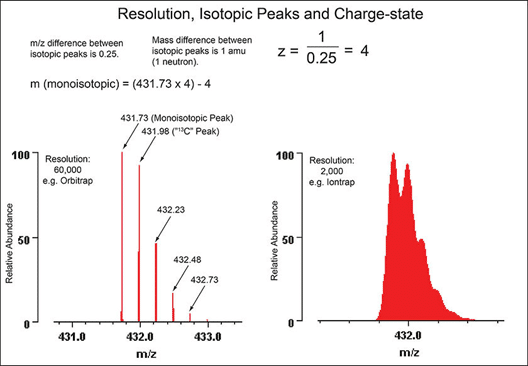
Figure 4. An example of isotopic resolution of an ion with a charge state of 4, [M]4+ achieved through high resolution mass spectrometry on an orbitrap compared to normal resolution of the same ion when analyzed on a traditional ion trap.3
Footnotes:
- [1] Fiehn Lab – Mass Resolution and Resolving Power
- [2] LCT Premier: Enhanced MS Resolution | Waters
- [3] Mass Spectrometry | Chromatography | Larance Laboratory